
Advanced Scatterometer – ASCAT
Table of Contents
What is Advanced Scatterometer or ASCAT?
Step 1: Go to the MOST website:
Step 2: Select area of interest
Step 3: Here’s an example of what you get!
What is Advanced Scatterometer or ASCAT? |
Advanced Scatterometer data, sometimes referred to as “ASCAT,” can provide near real-time analysis of wind speed and wind direction virtually anywhere on the world’s oceans or other large bodies of water.
Scatterometer data is a relatively new form of satellite information available to the public for the last few years. The “quick explanation” of how it works is that reflected microwaves initiated from satellites measure the aeration in the water’s surface. From that measurement, the wind speed can be deduced and, by doing a series of calculations over progressive images, wind direction can also be deduced.
|
Why is it helpful?
|
Generally, the information is amazingly accurate. However, it’s been our experience when talking with navigators on the water that sometimes the wind directions can be off by as much as 30 degrees. Keep in mind that their observations may be subject to local conditions, such as a cloud formation, rain, being in the lee of an island, or other conditions. The satellite image may pick up an average of the conditions that had been taking place earlier. However, when compared to actual buoy data, the Scatterometer data is usually very close.
Since it is available in near real time on the web, it can be useful in looking at wind conditions in remote locations offshore or other places that may not have buoys or ships’ reports close at hand. It can also be used to determine how much wind is associated with various weather features defined in a surface analysis.
|
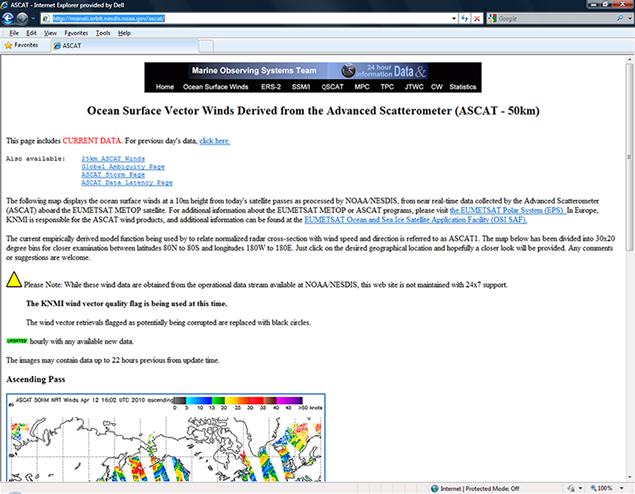
Step 1: Go to the MOST website:http://manati.orbit.nesdis.noaa.gov/ascat/
|
|
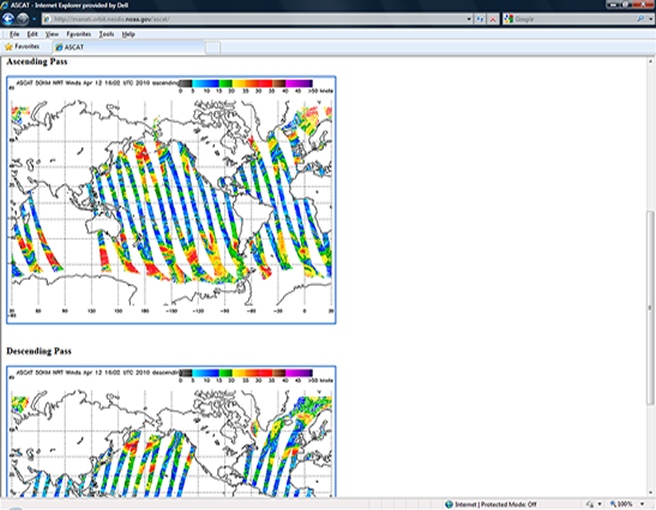
Step 2: Select area of interestScroll down to either the Ascending or Descending Pass and click on your area of interest. These are polar orbiting satellites and the path shifts to the west on every path and “scans” the earth in sequential passes. Therefore, there will be gaps in the scans in every pass.
Hence, depending on the path, the satellite will generally cover your location either on the ascending or descending pass. If not, wait an hour or so until your area is “scanned.”
The images are updated in “near real-time.” Therefore, make sure that you pay close attention to the valid date at time on the top of the graphic.
|
|
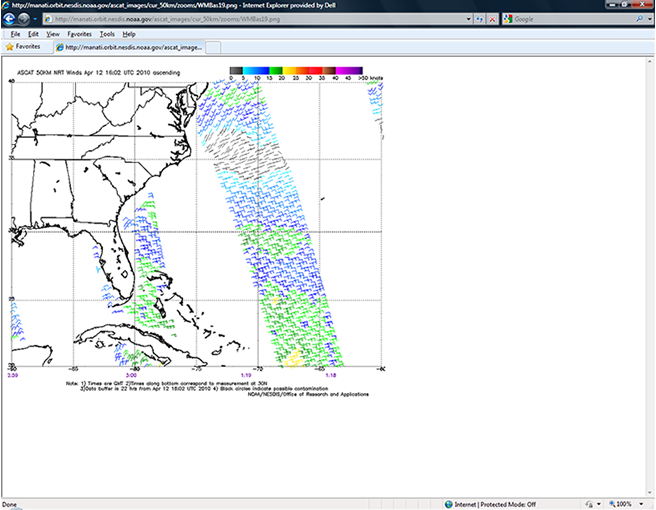
Step 3: Here’s an example of what you get!
|
|
|
For More Information |
For a more detailed description of scatterometer images and more examples, visit NASA’s website:
http://earthobservatory.nasa.gov/Newsroom/NasaNews/2004/2004011416395.html |

©2010 L. Roberts and B. Biewenga
(203) 389-4440
Last Modified: April 12, 2010