
Weather Map Symbols, Abbreviations, and Features
Table of Contents
Center pressures (on Surface Maps)
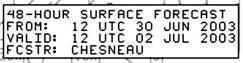
Valid Time of the weather chart
Center pressures (on Surface Maps)
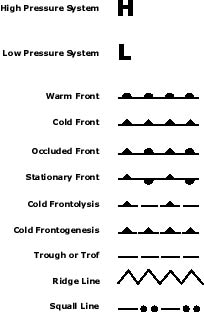
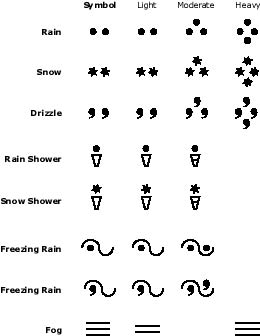
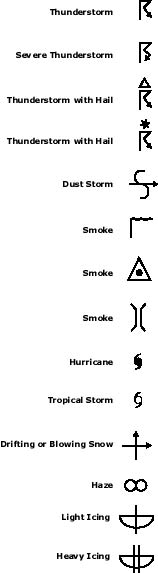
1. Symbols
Pressure Systems/Fronts |
|
Precipitation |
|
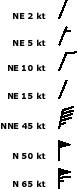
Wind Speed |
|
Center pressures (on Surface Maps) |
H = Center of High Pressure at Valid Time L = Center of Low Pressure at Valid Time
U = Center of High Pressure 24-hours prior to or after Valid Time Í = Center of Low Pressure 24-hours prior to or after Valid Time |
2. Abbreviations
a. General Abbreviations
|
Abbreviation |
Term |
|
DCRS |
Decreasing |
|
DSIPT |
Dissipating |
|
FRMG |
Forming |
|
GALE |
Gale (winds of 35 knots or more) |
|
HVY |
Heavy |
|
INCRS |
Increasing |
|
INTSFY |
Intensifying |
|
ISOLD |
Isolated |
|
Mb, In Hg, hPa |
Millibars, Inches of Mercury, hectopascals (formerly millibars) |
|
MOVG |
Moving |
|
NUMRS |
Numerous |
|
RPDLY |
Rapidly |
|
SCT |
Scattered |
|
STNRY |
Stationary |
|
STORM |
Storm (winds of 50 knots or more) |
|
TROF |
Trough |
|
TRPCL WAVE |
Tropical wave |
|
Z, UTC, GMT |
Time in Zulu, Universal Coordinated Time, Greenwich Mean Time (all equivalent) |
b. Cloud Abbreviations
|
CU |
Cumulus (light showers) |
|
ST |
Stratus (low clouds/fog) |
|
SC |
Stratocumulus (mainly fair) |
|
TCU |
Towering Cumulus (moderate showers) |
|
CB |
Cumulonimbus (thunderstorms) |
|
AC |
Altocumulus (middle level) |
|
AS |
Altostratus (middle level) |
|
CI |
Cirrus (high level) |
|
CS |
Cirrostratus (high level) |
c. Area Cloud Coverage
(in eights)
|
CLR |
Clear (0 – 1/8) |
|
SCT |
Scattered (1/8 – 3/8) |
|
BKN |
Broken (4/8 – 7/8) |
|
OVC |
Overcast (8/8) |
3. Map Features
|
Element |
Explanation |
Example |
Valid Time of the weather chart
|
Valid Time refers to the date and time that the information a weather chart is expected to reflect reality.
There are two kinds of weather fax maps: analysis and forecast. The boxed inset on the chart will indicate the chart's type, and will specify valid time.
|
Current Analysis
Forecast
These are examples from Surface Analysis maps (both Current Analysis and Forecast). The information would be the same on Upper Atmosphere (500mb) maps.
|
|
Element |
Explanation |
Example |
Isobar |
An isobar is a line of equal barometric pressure, usually drawn on surface maps. In many cases, isobars differ by 4 mb of pressure. |
|
|
Element |
Explanation |
Example |
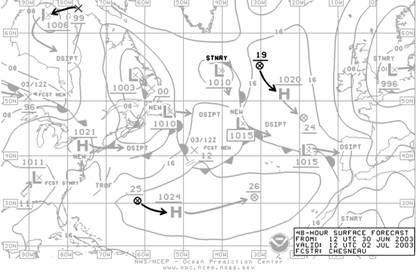
Center pressures (on Surface Maps)
H = Center of High Pressure at Valid Time
L = Center of Low Pressure at Valid Time
U = Center of High Pressure 24-hours prior to or after Valid Time
Í = Center of Low Pressure 24-hours prior to or after Valid Time
|
The center pressure of a low or high will be indicated by the 3 or 4 digit underlined number located beside the letter indicating the pressure center’s location (L or H on U.S. maps).
Future and previous pressure centers are sometimes also shown. (Refer to Arrow from and Arrow to below).
By comparing the current center pressure with the expected or previous center pressure, you can determine if the low is strengthening, high is weakening (numbers going lower) or the low is weakening, high is strengthening (numbers rising). |
|
|
Element |
Explanation |
Example |
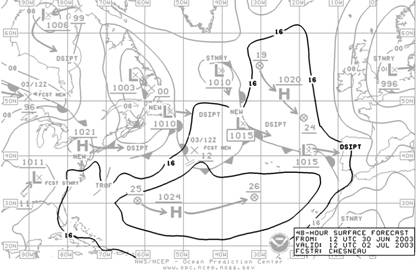
Arrow from
(Arrow indicating where low/high came from 24 hours prior to Valid Time)
|
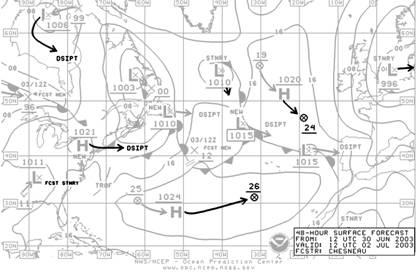
On some surface maps, an arrow will mark the place where a low (or high) pressure system was located 24 hours prior to the valid time indicated on the chart.
In this example, the High pressure system at the bottom of the chart with pressure of 1024 mb should be located:
The High pressure system is weakening (i.e., pressure is decreasing).
|
Arrow pointing toward the expected center for the pressure system indicates where that pressure system was expected to be 24 hours prior to the Valid Time indicated on the weather map, and the 2 digit underlined number indicates its expected previous center pressure. Either a “9” or a “10” is to be assumed in front of the 2 digits. |
|
Element |
Explanation |
Example |
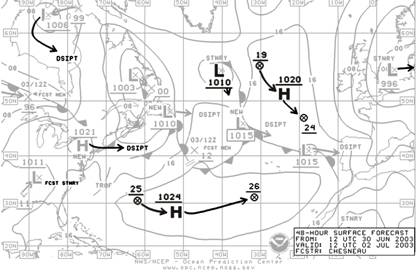
Arrow to
(Arrow indicating direction low or high is expected to move 24 hours after Valid Time)
|
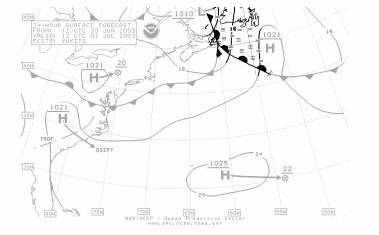
On some surface maps, an arrow shows where the low (or high) pressure system will be located 24 hours after the valid time indicated on the chart.
Noting how the center pressure is changing over time helps us understand whether the system is getting weaker or stronger.
In this example, the High pressure system at the bottom of the chart with pressure of 1024 mb should be located:
The High pressure system is strengthening (i.e., pressure is increasing).
|
Arrow pointing away from the expected center for the pressure system indicates where that pressure system will be expected to be 24 hours after the Valid Time indicated on the weather map, and the 2 digit underlined number indicates its expected future center pressure. Either a “9” or a “10” is to be assumed in front of the 2 digits. |
|
Element |
Explanation |
Example |
Double hash mark on front
|
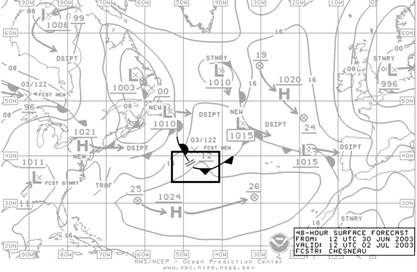
Double hash marks indicate that the type of front is changing at the point where the marks are placed (for example, a cold front changing to a stationary front).
|
|
Fog/freezing rain
|
Two or three horizontal parallel lines indicate fog or heavy fog
Two or three vertical parallel lines indicate freezing rain or heavy freezing rain.
|
|

|
Element |
Explanation |
Example |
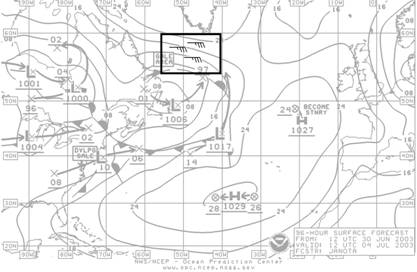
Wind barb
(Wind barb and how to tell both wind speed and direction)
|
Wind barbs can be likened to arrows flying through the air. The wind is flowing in the direction that the “arrow” appears to be flying, and the number of “feathers” indicates the wind speed. One “feather” is approximately 10 knots. Two feathers represents approximately 20 knots. A “half feather” is approximately 5 knots. A “black flag” is approximately 50 knots, and so forth.
|
Direction of general wind flow:
Wind will flow in a clockwise direction around a Northern Hemisphere High Pressure system, toeing out about 15 degrees from the high. Wind will flow in a counter-clockwise direction around a Northern Hemisphere Low Pressure system, toeing in about 15 degrees toward the low.
Wind will flow in a counterclockwise direction around a Southern Hemisphere High Pressure system, toeing out about 15 degrees from the high. Wind will flow in a clockwise direction around a Southern Hemisphere Low Pressure system, toeing in about 15 degrees toward the low.
|
©2010 L. Roberts and B. Biewenga
(203) 389-4440
Last Modified: April 23, 2004